Pandemic stress effects are hitting some harder than others
We are coming up on a year since the pandemic hit and began changing our lives in dramatic ways. Using data collected by federal agencies, we wanted to know who’s mental health is struggling most during these extraordinary times.
When the pandemic first hit, the National Center for Health Statistics (NCHS) partnered with the Census Bureau on an experimental data system called the Household Pulse Survey. This 20-minute online survey was designed to complement the ability of the federal statistical system to rapidly respond and provide relevant information about the impact of the coronavirus pandemic in the U.S.
They began collecting survey data on April 23 and have shared the results of these surveys through December 7. We took a look at the data to create a snapshot view of which groups in the United States are struggling the most and may need the most mental health attention.
National Results
Starting with the big picture, at the beginning of the pandemic 35.9% of those surveyed said they experienced symptoms of anxiety and depression within the last seven days. By December 7, that number rose by 5.5% to 41.4%.
Symptoms by Age Group
While every age group except the oldest reported increasing symptoms of anxiety and depression, it is clear from this survey that the youngest age groups are struggling more with these symptoms. People in this age group may be more likely to suffer economically as businesses close and unemployment rises. They are also more likely to be caring for school-aged children and may be suffering increase levels of anxiety and depression related to school shutdowns.
| Age Group | April 23 | Dec 7 | % Change |
| 18-29 years | 46.8% | 56.5% | +9.7% |
| 30-39 years | 39.6% | 47.6% | +8% |
| 40-49 years | 38.9% | 45.3% | +6.4% |
| 50-59 years | 35.8% | 40.0% | +4.2% |
| 60-69 years | 28.9% | 32.3% | +3.4% |
| 70-79 years | 21.5% | 26.4% | +4.9% |
| 80 years + | 21.1% | 19.4% | -1.7% |
Symptoms by Gender
School shutdowns have proven to negatively impact women over men since the pandemic began. In April, already 40.7% of the women surveyed reported symptoms of anxiety and depression. By December that number had increased 5% to 45.7%.
Men on the other hand also experienced increased symptoms. At the beginning, 31% of the men surveyed admitted to experiencing symptoms of anxiety and depression. By December 36.8% of men reported experiencing these symptoms, which is a 5.8% increase.
Symptoms by Race/Hispanic Ethnicity
While African American and Asian respondents indicated increased levels of anxiety and depression at the end of the year, they reported less of an increase than Caucasian, multi-racial and Hispanic/Latino repsondents.
| Race/Hispanic Ethnicity | April 23 | Dec 7 | % Change |
| Hispanic/Latino | 42.7% | 48.0% | +5.3% |
| Non-Hispanic Asian, single race | 31.9% | 35.0% | +3.1% |
| Non-Hispanic black, single race | 38.9% | 42.5% | +3.6% |
| Non-Hispanic white, single race | 33.6% | 39.6% | +6% |
| Non-Hispanic, other races & multi-racial | 43.9% | 49.8% | +5.9% |
Symptoms by Education Level
One of the biggest increases in levels of anxiety and depression occurred in people with less than a high school diploma. This may be because they were most likely to become unemployed during shutdowns and also because they may have fewer coping skills and less ability to understand what has become a complex and confusing news cycle.
| Level of Education | April 23 | Dec 7 | % Change |
| Less than a high school diploma | 45.5% | 53.0% | +7.5% |
| High school diploma or GED | 36.7% | 42.3% | +5.6% |
| Some college/Associate’s degree | 38.5% | 45.0% | +6.5% |
| Bachelor’s degree or higher | 30.7% | 35.0% | +4.3% |
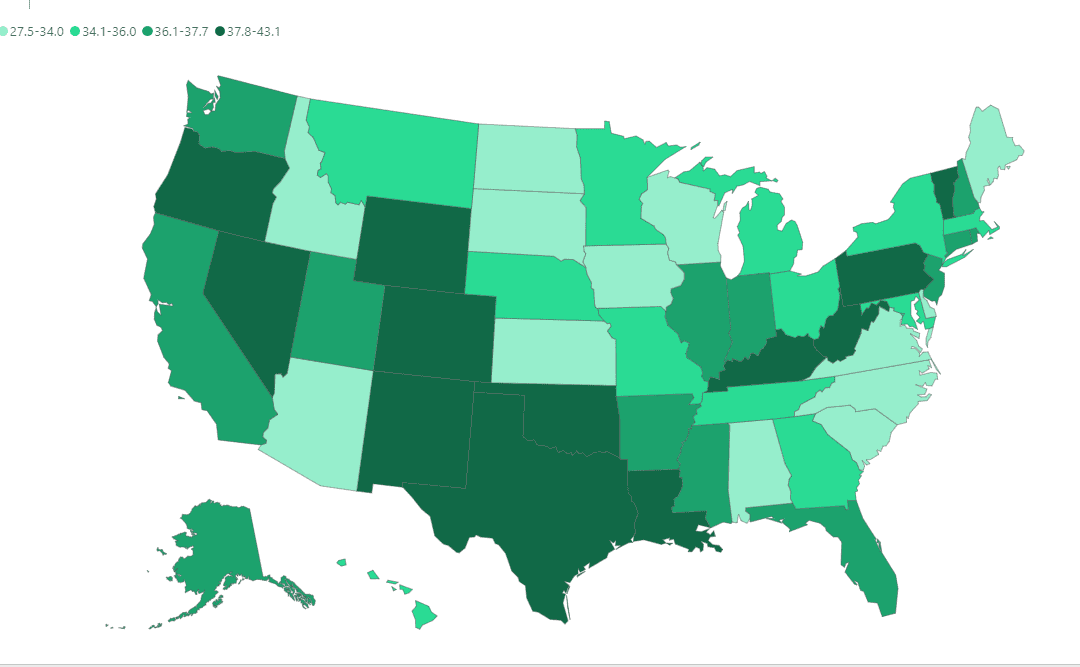
State-by-State Results
Probably the most stunning of the survey’s results is the difference in reported symptoms between states. We looked at the Top 10 states and compared them to the bottom 10 states. A very large difference emerged.
Looking at how citizens of individual states are faring during the pandemic revealed that symptoms of anxiety and depression vary greatly by geography. We think it will be interesting to further study this dynamic to discern what factors influenced these differences in experience. Regardless, the data also suggests areas where there is a significantly increased need for mental health services in the coming months to years.
Top 10 States
| State | April 23 | Dec 7 | % Change |
| New York | 41.4% | 39.6% | -2.5% |
| Massachusetts | 40.6% | 39.4% | -1.2% |
| South Caroline | 33.3% | 33.6% | +0.3% |
| Michigan | 39.4% | 40.1% | +0.7% |
| Connecticut | 40.2% | 41.6% | +1.4% |
| Florida | 36.8% | 39.4% | +2.6% |
| Maine | 34.3% | 36.9% | +2.6% |
| New Jersey | 37.6% | 40.8% | +3.2% |
| Arizona | 36.4% | 39.8% | +3.4% |
| Georgia | 36.2% | 39.9% | +3.7% |
Bottom 10 States
| State | April 23 | Dec 7 | % Change |
| Wyoming | 31.0% | 44.8% | +13.8% |
| Nevada | 34.8% | 47.2% | +12.4% |
| Mississippi | 34.5% | 46.8% | +12.3% |
| Montana | 27.3% | 39.4% | +12.1% |
| New Mexico | 34.6% | 46.1% | +11.5% |
| Alaska | 31.5% | 42.6% | +11.1% |
| Nebraska | 28.6% | 39.6% | +11.0% |
| Oregon | 36.8% | 47.6% | +10.8% |
| West Virginia | 34.3% | 44.2% | +9.9% |
| Oklahoma | 34.1% | 43.9% | +9.8% |
Conclusions
It may not be possible to understand everything we need to understand about the pandemic by looking only at levels of anxiety and depression; however, we believe that by understanding who is most likely to be suffering increased stresses and where those people live that we can better understand how mental health practitioners and facilities can best prepare for 2021 to deliver these much-needed services.
Here at Substance Solutions, we are constantly looking at insurance reimbursement numbers, mental health statistics and asking mental health facilities what they need most to maximize their billing efficiency.
SOURCE: https://www.cdc.gov/nchs/covid19/pulse/mental-health.htm